East Africa Metals
  • Home
  • About
    • Overview
    • Management
    • Directors
    • Mining Advisory
    • Corporate Info
    • Legal / Privacy / Governance
  • Ethiopia
    • Ethiopian Projects
      • Mining in Ethiopia
      • Maps
      • Harvest Project
      • Adyabo Project
      • Investor Deck
      • Photos
      • Corporate Responsibility
    • Harvest
      • Harvest Project
      • Maps
      • Terakimti Trend
      • Geological Maps
      • Economics
      • Technical Reports
      • Photo Gallery
    • Adyabo
      • Adyabo Project
      • Maps
      • Mato Bula Trend
      • Geological Maps
      • Economics
      • Technical Reports
      • Photos
  • Tanzania
    • Handeni Project
    • Maps & Geology
    • Resource Estimate
    • Technical Reports
    • Photos
    • Community Responsibility
  • Investors
    • Stock Quote
    • Investor Presentation
    • Video
    • Filings & Reports
    • Investor Contact
  • News
    • News Releases
    • In the News
    • Media Contact
  • Contact
    • Contact Information
    • Investor Sign-up
  • Search
  • Menu Menu

Ethiopia – Developing gold and precious polymetallic projects in the Arabian-Nubian Shield

  • Adyabo Project
  • Maps
  • Mato Bula Trend
  • Geological Maps
  • Economics
  • Technical Reports
  • Photos

Adyabo – a 195.5 km2 property with two high value project mining licences granted by the Ethiopian Ministry of Mines

THE ADYABO PROJECT

Mato Bula Gold Copper and Da Tambuk Gold Projects

The Adyabo Project Mato Bula and Da Tambuk deposits are high sulphidation gold rich VMS. This submarine porphyry-related system is located in the southern part of the Arabian-Nubian Shield (ANS) in the Tigray region of northern Ethiopia. Mining licences have been received that cover both deposits on Adyabo, Mato Bula Au-Cu-Ag and Da Tambuk Au.

Tibet Huayu Mining Co. Limited (“THM”) is be responsible for 100% financing of both Adyabo’s Mato Bula and Da Tambuk mine construction costs resulting in a 70% THM and 30% EAM ownership.

In April 2018, Preliminary Economic Assessment (PEA) results were released on the Mato Bula Gold Copper and Da Tambuk Gold Projects, indicating very strong project economics. For Mato Bula, the post-tax NPV is US$56.7 million (8% discount rate), and an IRR of 28.4%. For Da Tambuk, the post-tax NPV is US$13.0 million, with an IRR of 28.6%.

The Adyabo Project Covers 195.5 km2

The original Adyabo project (Adi Dairo and West Shire concessions) covers 195.5 km2 west of East Africa Metals’ Harvest Project and is located in an under explored part of the Arabian-Nubian Shield in Northern Ethiopia. East Africa Metals acquired its interest in the Adyabo Project through its acquisition of Tigray Resources Inc. in 2014. In December 2011 Tigray entered into an agreement to acquire up to an undivided 80% interest in the Adyabo property in two phases over a three-year period. In November 2012, Tigray received TSX Venture Exchange approval for the acquisition of the Adyabo property in Ethiopia and advanced the first phase of the earn-in. In February 2016, East Africa Metals originally obtained 100% interest in Adyabo by converting the remaining 20% ownership to a 2% NSR. The area is highly prospective for high sulphidation gold rich volcanogenic massive sulfide (VMS) – submarine porphyry related high-grade Au-Cu +/- Zn, and orogenic (structurally controlled) gold deposits, and contains numerous alluvial, eluvial, and bedrock artisanal gold workings.

Known High Sulphidation Gold Rich VMS

The project area includes several major linear NNE trending shear zones which truncate rocks of the Zager Mafic and Ultramafic Belt in the centre of the project area, with the Adi Hageray Block to the west and the Adi Nebrid Block to the east. Known high sulphidation gold rich VMS – submarine porphyry related high-grade Au-Cu +/- Zn related mineralization in the east of the project includes the Mato Bula and Da Tambuk Prospects, and multiple gold prospects are present along the regional structures of the Zager Mafic and Ultramafic Belt. Multiple generations of intrusions throughout the project include gabbro, pyroxenite, granite, and granodiorite.

Recent work has been focussed on defining drill targets through follow-up and first pass exploration. Over 50,000 geochemical soil, stream, and rock chip samples have been completed, defining numerous gold and base metal anomalies. These anomalies have been followed-up with trenching, rock chip sampling, detailed mapping, and logistical preparation for drilling.

Development and Operation of the Adyabo Project’s Mato Bula and Da Tambuk Deposits

Effective Aug. 9, 2019, Tibet Huayu Mining Co. Ltd. and East Africa Metals Inc. have agreed and concluded certain documentation for the previously announced Adyabo transaction (see East Africa news release dated July 2, 2019). With the signing of an amendment to the share purchase agreement executed in June, 2019, the parties have agreed that all conditions precedent and obligations required for closing under the share purchase agreement have been met or waived, and the parties are now proceeding toward formally closing the transaction. The company has received conditional acceptance of the transaction from the TSX Venture Exchange and anticipates receiving final approval from the exchange in due course. Under the transaction, THM, through its wholly owned subsidiary, Silk Road Resources Investments Co. Ltd., will conduct the development and operation of the Adyabo project’s Mato Bula and Da Tambuk deposits located in the Tigray region of the Federal Republic of Ethiopia.

Highlights:

  • EAM has received a cash payment of US$1.2M on closing of the transaction and retain a 30% Net Profit Interest.
  • THM is financing 100% of the capital costs and operate the mine development program and mining operations.
  • Estimated capital costs for construction of US$54 million for Mato Bula and US$34 million for Da Tambuk (see East Africa News Release dated April 30, 2018).
  • EAM retains the exploration rights to all prospective mineralization on its concession areas outside of the current resource.

Adyabo Gold Project Maps & Geology

Location in the Arabian-Nubian Shield

Adyabo & Harvest Project Concessions

Adyabo Project Concessions

Mato Bula Trend, Adyabo

MATO BULA Au-Cu-Zn TREND

The Mato Bula trend is a greater than 8 kilometre long zone of alteration characterized by sericite, pyrite (10%), carbonate (generally dolomite), and silica mineralization, which has undergone strong shearing. This assemblage comprises many elements consistent with high sulphidation gold rich VMS – submarine porphyry-related systems. The trend hosts additional geochemical targets at surface, and possesses significant upside to further discoveries both along strike and at depth. Additional targets include Halima Hill (a large target generated from a 2017 I.P. geophysical survey), Mato Bula Central, Silica Hill, Silica Hill North, and Mato Bula North, which all are open to expanding known mineralization. Da Tambuk also remains open to depth and south. Potential resource extraction is supported by favourable topography over mineralized areas.

Adyabo Resource

  • Indicated Mineral Resources of 3,215,000 tonnes containing 408,000 ounces of gold at an average grade of 3.92 g/t gold, 16,800,000 lbs copper at an average grade of 0.24% copper, and 132,000 ounces silver at an average grade of 1.4 g/t silver.
  • Inferred Mineral Resources of 5,930,000 tonnes containing 273,000 ounces gold at an average grade of 1.43 g/t gold, 65,700,000 lbs copper at an average grade of 0. 50%, copper, and 559,000 ounces silver at an average grade of 2.9 g/t silver.
  • In the mineral resource update published June 2016, the gold grade for the Indicated portion of the resource increased to 3.92 grams per tonne gold, compared with the initial overall Inferred Resource grade of 2.26 grams per tonne gold, an increase of 73%.
  • In complement to this increased grade, over 95% of the Indicated equivalent gold ounces are recoverable via the near surface Pit Constrained model.

Adyabo Project Mineral Resource Estimate

David Thomas, P. Geo. (Effective Date: May 31, 2016)

Gold Copper Silver Gold Equivalent Gold Metal Copper Metal Silver Metal Gold
Equivalent
Metal
Category Tonnes (Au g/t) (Cu %) (Ag g/t) ( Au g/t) (Au Oz) (Cu Mlbs) (Ag Oz) (Oz)
Indicated 3,215,000 3.92 0.24 1.4 4.29 408,000 16.8 132,000 446,000
Inferred 5,930,000 1.43 0.50 2.9 2.27 273,000 65.7 559,000 434,000

Adyabo Resource Highlights

  • The Mineral Resource is defined to a vertical extent of 450, 200, and 170 metres for Mato Bula, Da Tambuk, and Mato Bula North respectively, with potential for lateral and depth extension within this large altered system.
  • Copper concentrate grades ranged from 23% to 27% Cu, 170 to 850 g/t Au, and 27 to 240g/t Ag. Total gold recoveries, inclusive of copper floatation and cyanidation tests, ranged from 77% to 97%*
  • Whole mineralization cyanidation of Da Tambuk and intensive leaching of a Da Tambuk pyrite scavenger concentrate both returned gold recoveries of 97% suggesting that the gold within this composite is not refractory and the flotation-only recovery of 57% could be improved by cyanidation of flotation products.
  • Additional metallurgical optimization is possible through regrind work, collector dosage variation, and comminution testwork.
  • Synergies available as Resources are spatially aligned on a corridor of infrastructure (including the national power grid transmission corridor and paved highway) with the company’s adjacent Terakimti deposit at the Harvest project, with direct connection to a planned rail network link at Shire.
    *Da Tambuk whole mineralization leach test and pyrite scavenger concentrate test both returned gold recoveries of 97%.
    1 Base Case – Au $1,400/oz, Cu $3.20/lb, Ag $20/oz

The Resource incorporates data from 15,295.8 metres of drilling in 84 drill holes, and 2,808 metres of trenching. It further builds upon the metal asset base East Africa is defining and accumulating on the Adyabo and Harvest projects in Ethiopia, as a complement to the Terakimti resource announced on January 27, 2014 and update announced October 27, 2015.

The current Resources at Adyabo and Harvest straddle an infrastructure corridor, with projects being located within 11 and 7 kilometres respectively of a paved highway and a high-tension power corridor (Figure 2).

Adyabo Project Indicated Mineral Resource Estimate

David Thomas, P. Geo. (Effective Date: May 31, 2016)

Pit Constrained Gold Copper Silver Gold
Equivalent
Gold
Metal
Copper
Metal
Silver
Metal
Gold
Equivalent
Metal
Area Cut-Off
($/t)
Tonnes (Au g/t) (Cu %) (Ag g/t) ( Au g/t) (Au Ozs) (Cu Mlbs) (Ag Ozs) (Ozs)
Da Tambuk 23.9 775,000 4.51 0.11 2.4 4.65 112,000 1.9 59,000 116,000
Mato Bula 23.9 2,280,000 3.74 0.28 1.1 4.18 278,000 14.0 70,000 310,000
Sub-Total Pit 23.9 3,055,000 3.94 0.24 1.4 4.30 390,000 15.9 128,000 426,000
     
Underground Mineral Resource Gold Copper Silver Gold
Equivalent
Gold
Metal
Copper
Metal
Silver
Metal
Gold
Equivalent
Metal
Area Cut-Off
($/t)
Tonnes (Au g/t) (Cu %) (Ag g/t) ( Au g/t) (Au Ozs) (Cu Mlbs) (Ag Ozs) (Ozs)
Mato Bula 63.9 160,000 3.57 0.25 1.0 3.96 18,000 0.9 3,000 20,000
Total PC + UG N/A 3,215,000 3.92 0.24 1.4 4.29 408,000 16.8 132,000 446,000

Adyabo Project Inferred Mineral Resource Estimate

David Thomas, P. Geo. (Effective Date: May 31, 2016)

Pit
Constrained
Gold Copper Silver Gold Equivalent Gold
Metal
Copper
Metal
Silver
Metal
Gold
Equivalent
Metal
Area Cut-Off ($/t) Tonnes (Au g/t) (Cu %) (Ag g/t) ( Au g/t) (Au Ozs) (Cu Mlbs) (Ag Ozs) (Ozs)
Da Tambuk 23.9 35,000 4.30 0.08 3.0 4.42 5,000 0.1 3,000 5,000
Mato Bula 23.9 3,010,000 2.13 0.34 2.4 2.67 207,000 22.2 237,000 259,000
Mato Bula North 23.9 2,470,000 0.27 0.70 3.2 1.49 22,000 38.3 252,000 119,000
Sub-Total Pit
Constrained
23.9 5,515,000 1.31 0.50 2.8 2.15 233,000 60.6 493,000 383,000
     
Underground Mineral Resource Gold Copper Silver Gold Equivalent Gold
Metal
Copper
Metal
Silver
Metal
Gold
Equivalent
Metal
Area Cut-Off ($/t) Tonnes (Au g/t) (Cu %) (Ag g/t) ( Au g/t) (Au Ozs) (Cu Mlbs) (Ag Ozs) (Ozs)
Da Tambuk 63.9 75,000 3.92 0.05 2.9 4.00 9,000 0.1 7,000 10,000
Mato Bula 63.9 330,000 2.77 0.65 5.4 3.82 30,000 4.7 58,000 41,000
Mato Bula North 63.9 15,000 0.75 0.79 2.6 2.10 400 0.3 1,000 1,000
Sub-Total Underground 63.9 420,000 2.91 0.55 4.8 3.80 39,000 5.1 66,000 51,000
Total PC + UG N/A 5,930,000 1.43 0.50 2.9 2.27 273,000 65.7 559,000 434,000

Footnotes to mineral resource statement:

  • Fladgate reviewed EAM’s quality assurance and quality control programs on the mineral resources data. Fladgate concludes that the collar, survey, assay, and lithology data are adequate to support mineral resources estimation.
  • Domains were modelled in 3D to separate mineralised rock types from surrounding waste rock. The domains were modelled based on copper and gold grades.
  • Raw drill hole assays were composited to 2 m lengths broken at domain boundaries.
  • Capping of high grades was considered necessary and was completed for each domain on assays prior to compositing.
  • Block grades for gold and silver were estimated from the composites using a combination of ordinary kriging and inverse distance weighted (power of three) interpolation method into 5 (along strike) x 2m (across strike) x 5 m (vertical) blocks coded by domain.
  • Dry bulk density varied by deposit area. The dry bulk densities are based on 559 specific gravity measurements at Da Tambuk, 1,755 specific gravity measurements at Mato Bula and 231 specific gravity measurements at Mato Bula North.
  • Blocks were classified as Indicated and Inferred in accordance with CIM Definition Standards 2014.
  • Indicated resources are classified on the basis of blocks falling within a drill hole spacing of 40 m x 40 m. The results of comparison with the previous mineral resource model, a drill hole spacing study and conditional simulation of gold grades were used to support the classification of Indicated mineral resources.
  • Inferred resources are classified on the basis of blocks falling within the mineralised domain wireframes (i.e. reasonable assumption of grade/geological continuity) with a maximum distance of 100 m to the closest composite
  • The mineral resource estimate is constrained within an optimised pit with a maximum slope angle of 50◦. Metal prices of $1,400/oz, $3.20/lb and $20.0/oz were used for gold, copper and silver respectively. Metallurgical recoveries of 97% for gold, 72% for copper and 50% for silver were applied at Da Tambuk. Metallurgical recoveries of 88.5% for gold, 87.5% for copper and 50% for silver were applied at Mato Bula and Mato Bula North.
  • A pit constrained $/t cut-off was estimated based on a total process and G&A operating cost of $23.9/t of ore mined. An additional mining cost of $40/t was used to estimate a $/t cut-off of $63.9/t for reporting underground mineral resources.
  • The contained gold, copper and silver figures shown are in situ. No assurance can be given that the estimated quantities will be produced. All figures have been rounded to reflect accuracy and to comply with securities regulatory requirements. Summations within the tables may not agree due to rounding.
  • Mineral Resources which are not Mineral Reserves do not have demonstrated economic viability. The estimate of mineral resources may be materially affected by environmental, permitting, legal, title, taxation, sociopolitical, marketing, or other relevant issues.
  • The quantity and grade of reported inferred resources in this estimation are conceptual in nature and there has been insufficient exploration to define these inferred resources as an indicated or measured mineral resource and it is uncertain if further exploration will result in upgrading them to an indicated or measured mineral resource category.

Mato Bula Project Mine Site Layout, Adyabo

Mato Bula Trend Resource Location, Adyabo

Mato Bula Drill North Hole Location, Adyabo

Mato Bula Drill Hole Location, Adyabo

Mato Bula Upper Lode Long Section, Adyabo

Mato Bula Main Lode Long Section, Adyabo

Da Tambuk Project Mine Site Layout, Adyabo

Da Tambuk Drill Location, Adyabo

MATO BULA AND DA TAMBUK PRELIMINARY ECONOMIC ASSESSMENTS

On April 30, 2018, EAM received Preliminary Economic Assessment (PEA) results from Tetra Tech Canada Inc. for the Mato Bula Gold Copper and Da Tambuk Gold Projects.  Below is a summary of the results.  Additional details can be found in the company’s press release dated April 30, 2018, and in the 43-101 report which will be filed on www.sedar.com and the company’s website within 45 days of the release.

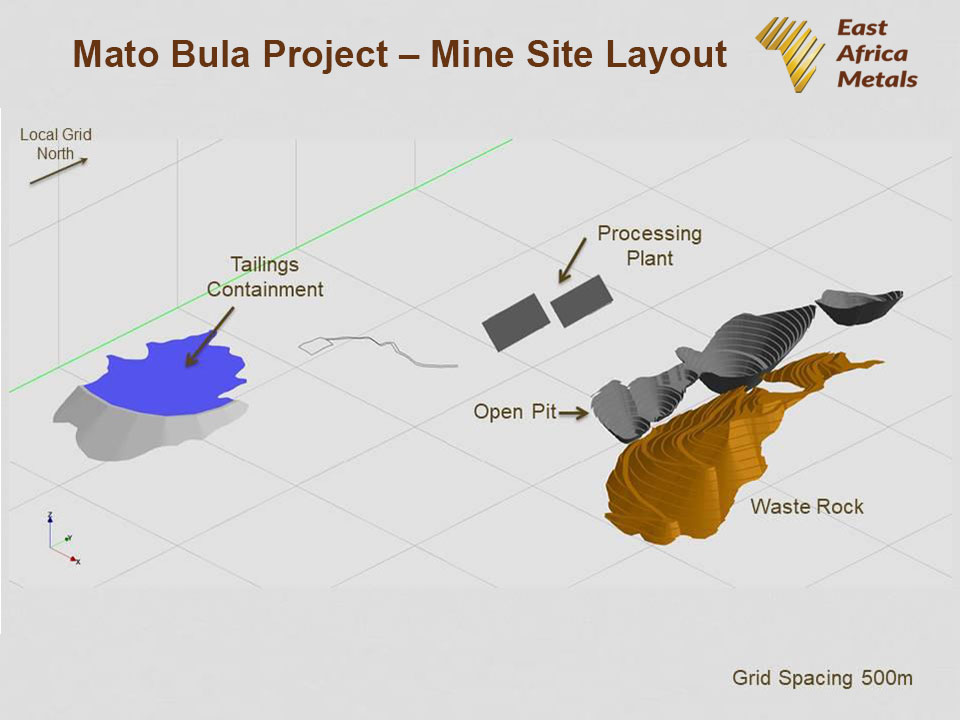
Mato Bula Gold Copper Project

  • Post-tax NPV of US$ 56.6M for base case using US$1,325 /oz Au, US$3.00/lb copper and US$17.00/oz silver, at an 8% discount rate.
  • Payback of pre-production capital in 3 years from start of production.
  • C1 cash operating cost of US$412/oz Au including all on-site costs and AISC cost of US$620/oz Au calculated with all on-site and off-site costs, TCRC charges, sustaining costs and net of by-product credits.
  • Average annual metal production of approximately 34,750 ozs gold, 1.67 million pounds copper and 4,780 ozs silver.
  • Pre-production capital cost of US$54.2M million including contingency of 38% on direct costs and 26% on total of direct and indirect costs.
  • Open pit mining utilizing drill blast, trucks and shovels, waste stripping ratio of 9/1.
  • Processing rate of 1,400 t/day using conventional crush/grind comminution, gravity concentration and flotation to produce a copper-gold concentrate. In addition a gold bearing pyrite concentrate will be produced and treated off-site by Carbon in Leach technology.
  • Life-of-mine metal recoveries of 86.4% for gold, 87.4% for copper, and 50% for silver.
  • Concentrate grades average approximately 132 g/t gold, 25.5% copper and 28 g/t silver.
  • Minimum 8 year mine life, based on proposed open pit depth of 190 metres.
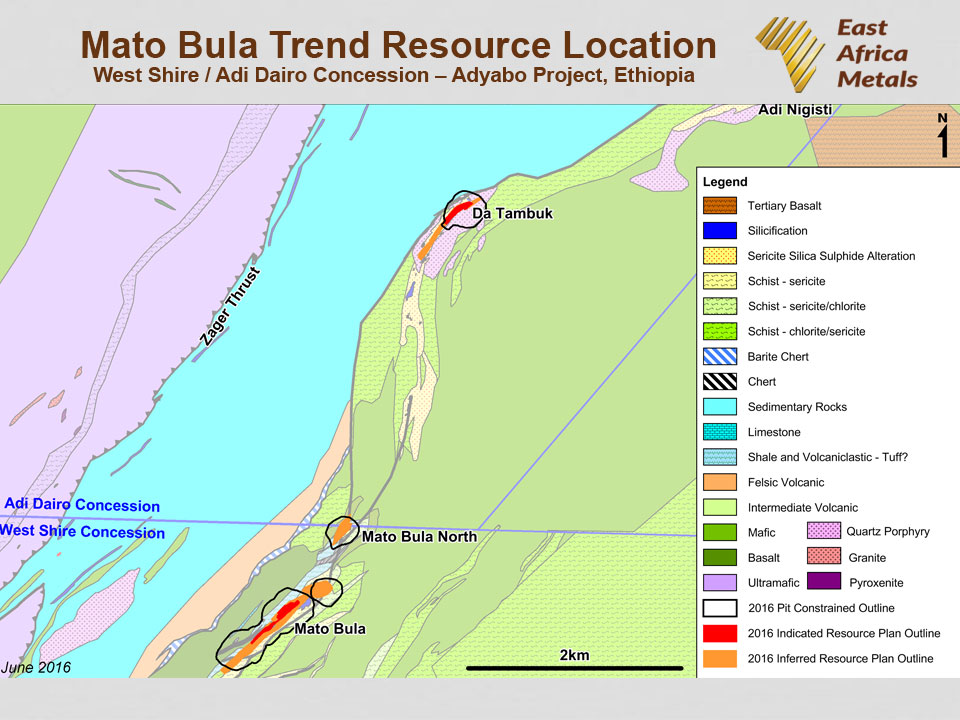
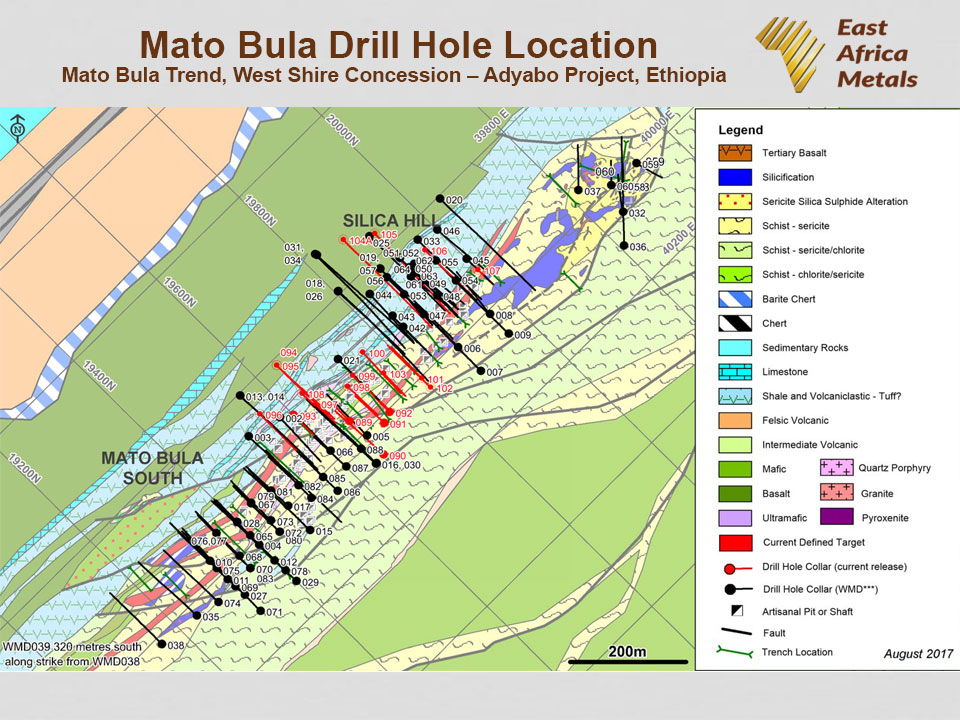
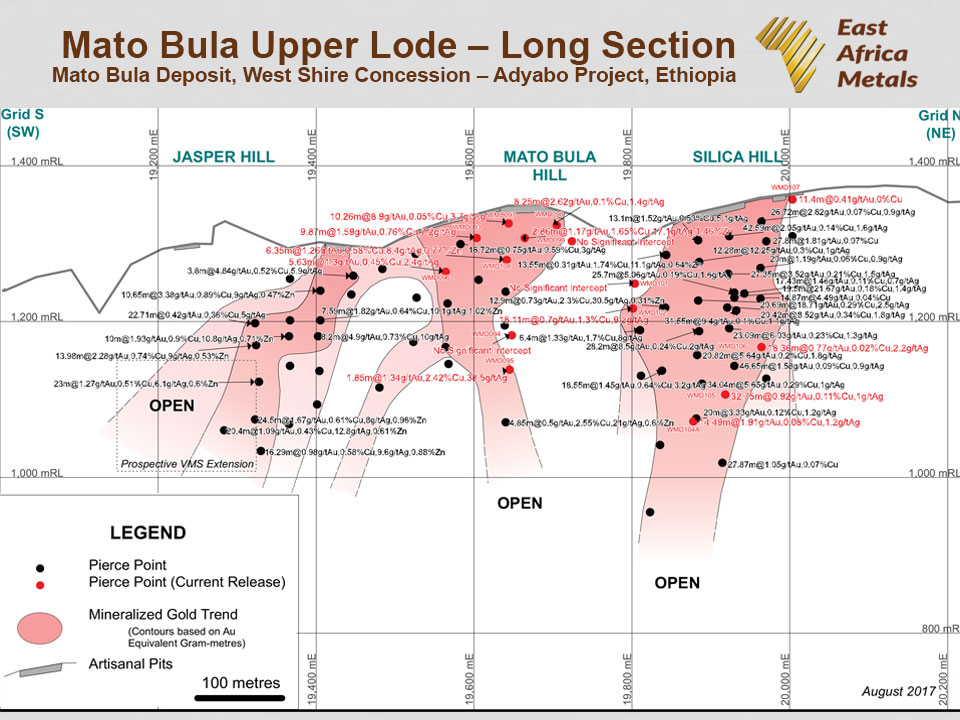
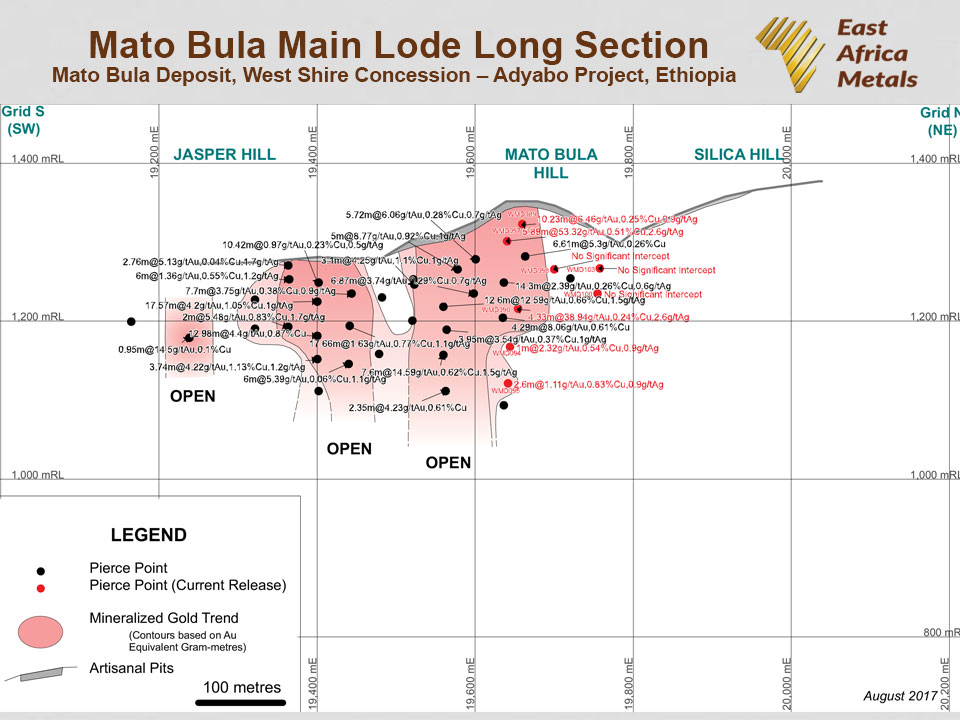
  • Significant potential exists to extend mine life as drilling has identified mineralization along strike and to 370 metres down dip.

Da Tambuk Gold Project

  • Post-tax NPV of US$13.0 M and IRR of 28.6% for base case using US$1,325 /oz Au and US$17.00 /oz silver, at 8% discount rate.
  • Payback of pre-production capital in 1.9 years from start of production.
  • C1 cash operating cost of US$420/oz Au including all on-site costs and AISC cost of US$642/oz Au calculated with all on-site and off-site costs, TCRC charges, sustaining costs and net of by-product credits.
  • Average metal production of approximately 24,000 ozs gold per year and 6,000 ozs silver per year.
  • Pre-production capital cost of approximately US$34.1 M including contingency of 36% on direct costs and 26% total of direct and indirect costs.
  • Underground trackless mining utilizing ramp access, cut and fill and open stope mining.
  • Processing rate of 550 tonnes per day using crush/grind comminution, gravity concentration and CIL technology.
  • Average life-of-mine metal recoveries of 93% for gold and 50% for silver.
  • Minimum 4 year mine life based on mining plan depth to 200 metres below surface.
  • Excellent potential to extend mine life as drilling has intersected significant mineralization to 260 metres down dip.

Key Technical Pre-tax and Post-tax Metrics

Key technical and base case pre-tax and post-tax metrics for Mato Bula and Da Tambuk are presented below:

PARAMETER(3)   Units Mato Bula Da Tambuk
Mine Plan   Tonnes 3,335,000 650,000
Grade Gold g/t 3 4.9
  Copper % 0.26
  Silver g/t 0.7 2.3
Metal Recoveries Gold % 86.4% 93.0%
  Copper % 87.4%
  Silver % 50.0% 50.0%
Recovered Metals Gold Ozs 278,000 95,000
  Copper Lbs (x000) 13,353
  Silver Ozs 38,300 24,000
  Au Eq(4) Ozs 305,000 95,000
Capital Cost   US$(x000)  $      54,200  $     34,030
Sustaining Capital   US$(x000)  $        5,600  $       8,030
Operating Cost Site – C1 US$/tonne  $        47.53  $       61.85
Metal Prices  
Gold Price US$/oz    $        1,325  $       1,325
Copper Price US$/lb    $          3.00
Silver Price US$/oz    $        17.00  $            17
PRE-TAX  
Cash Flow   US$(x000)  $    139,710  $     31,160
NPV @8%   US$(x000)  $      83,820  $     20,670
IRR   % 34.1% 37.8%
POST-TAX  
Cash Flow LOM US$ (x000)  $      97,700  $     20,615
NPV @8%   US$ (x000)  $      56,660  $     13,020
IRR   % 28.4% 28.6%
OTHER METRICS  
Payback   Years 3.0 1.9
C1 Op Cost   US$/oz Au  $           412  $          420
AISC   US$/oz Au  $           620  $          642

Notes:
(2) Cash Flows presented are not discounted.
(3) Values may not reconcile to others disclosures within the news release due to rounding.
(4) Au Equivalent ozs = Au ozs + Cu lbs*0.0023 + Ag ozs *0.0128

Risk and Opportunities

As with all mining projects, a number of opportunities and risks exist that may affect the outcome of the project.  Known opportunities and risks pertaining to both of the projects are identified immediately below, followed by a statement of opportunities and risks specific to each of the projects.

Opportunities for all Projects:

  • Potential exists to optimize metal recoveries and reduce reagent consumptions in the processing circuits.
  • Process equipment costs are based on North American supply and assessment of other equipment markets should be conducted to evaluate this cost reduction opportunity.
  • The close proximity of the Mato Bula and Da Tambuk projects creates an opportunity for combining of project resources, such as power supply, road access, water sources, administration and technical departments, which could reduce costs. Certain general facilities and services may possibly be shared with the Terakimti project as well.

Risks for all Projects:

  • Volatility of commodity prices.
  • Unforeseeable escalation of capital or operating costs.
  • Political stability, security and social opposition.
  • Unforeseen future changes in host country regulations that may have a direct impact on production and economics of the projects including and not limited to environment aspects and taxes.
  • Inherent geological risk and uncertainty.
  • Sourcing of skilled employees for mining and processing plant operation/QAQC control.
  • Metallurgical performance of the processing plant may be different than projections based on test work completed to date.
  • Potential sources of water supply for operations must be confirmed and may vary from the assumptions made in the studies.
  • The engineering assumptions and results presented in the PEA’s may vary from actual conditions.
  • Abnormally high precipitation events during the wet season may cause flooding in the minesite areas and/or restrict access to the project sites.

Project Specific Opportunities and Risks — Mato Bula Opportunities:

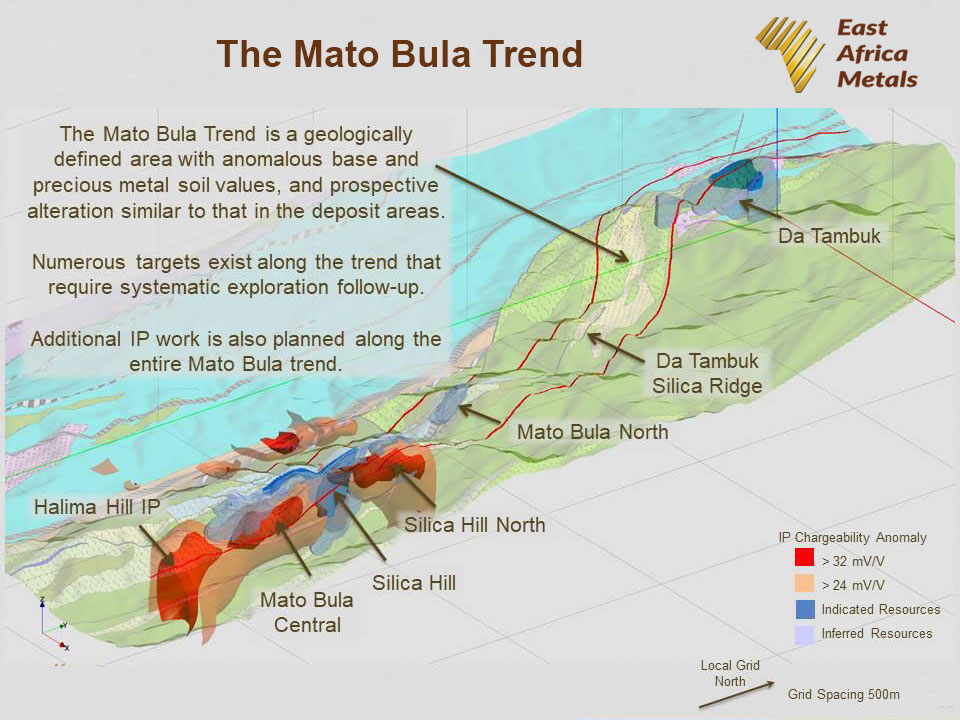
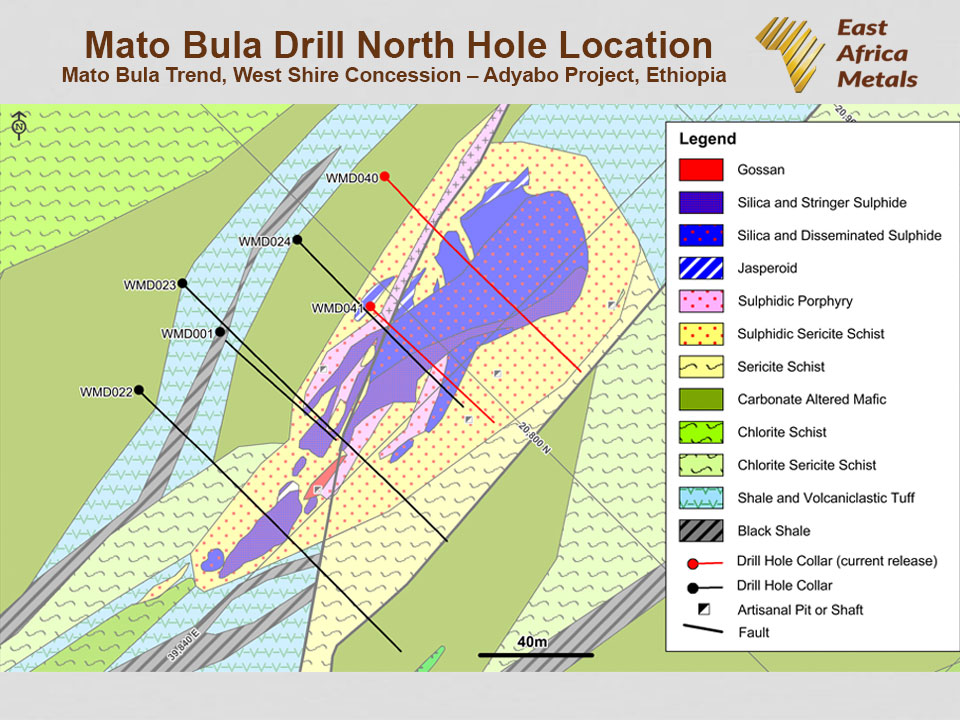
  • An updated resource estimate for Mato Bula is in development which will incorporate results of infill and exploration drilling completed in 2017. The results are expected to increase the level of confidence in the existing mineral resource estimates and identify additional areas of mineralization outside the current resource and mine plan.
  • Drilling completed to date has identified significant gold copper and zinc mineralization extending laterally and to depth, which upon future technical and economic assessment may serve to extend the life of the proposed mining operation.
  • The open pit scenario results in a high waste stripping ratio. Additional mine planning optimization, including assessment of underground mining may offer the potential to improve project economics.
  • Due to the close locations of Mato Bula and Da Tambuk, opportunities may exist for combining access, infrastructure and certain processing facilities to the benefit of both projects.

Risks:

  • Unforeseeable geotechnical conditions requiring shallower pit slopes than expected.
  • Higher strip ratios than planned.
  • Metallurgical test work completed to date is preliminary. Additional metallurgical test work is required to better understand the metallurgical performance.

Project Specific Opportunities and Risks — Da Tambuk
Opportunities:

  • An updated resource estimate for Da Tambuk is in development which will incorporate results of infill drilling completed in 2017. The results are expected to increase the level of confidence in the existing resource.
  • Drilling completed to date has identified significant gold mineralization extending laterally and to at least 260 metres down dip depth, which upon future technical and economic assessment may serve to extend the life of the proposed mining operation.
  • The mine plan is based predominantly on the use of cut and fill mining, with limited use of sublevel stoping. Improved understanding of ground conditions obtained in a dedicated geotechnical program, could provide justification for increased application of sublevel stoping, which would lower mining costs.
  • Due to the close locations of Mato Bula and Da Tambuk, opportunities may exist for combining infrastructure and certain processing facilities to the benefit of both projects

Risks:

  • Insufficient availability of skilled underground miners. Skills development and training, as well as hiring of expatriate workers are expected to be a key aspect of the operations.
  • Geotechnical conditions and rock quality parameters in the underground mine may be different than anticipated.
  • Metallurgical test work completed to date is preliminary. Additional metallurgical test work is required to better understand the metallurgical performance.
  • More underground dilution than planned.
  • Excessive ground water ingress into the underground mine.

Metallurgy Overview

Metallurgical test work for the Mato Bula Gold Copper and Da Tambuk Gold projects has been completed by Blue Coast Research, an independent metallurgical laboratory in Parksville B.C. Canada.

Positive preliminary metallurgical results have been received from composites derived from key mineralized zones at Mato Bula, Silica Hill, and Da Tambuk. Conventional copper floatation was successful in producing encouraging saleable copper gold concentrates, with additional gold recovery realized from cyanidation of gold bearing flotation products.

The metallurgical work was conducted on three diamond drill hole composite samples derived from gold intervals at Mato Bula, Silica Hill, and Da Tambuk, and samples were tested at the Blue Coast Research metallurgical facility in Parksville, BC. Coarse reject diamond drill hole material was utilized from 6 drill holes at Da Tambuk (Da Tambuk composite), and 11 drill holes (7 for the Mato Bula Main composite and 4 for the Silica Hill composite) from Mato Bula. A total of 151 samples were utilized for the composites, with composite grades averaging 11.1g/t Au and 0.3% Cu(Silica Hill), 6.6g/t Au and 0.99% Cu(Mato Bula Main), and 9.5g/t Au and 0.2% Cu(Da Tambuk).

Metallurgy Results Summary

Composite Flotation Performance Cyanidation Total
Cu Recovery, % Cu Grade, % Au Recovery, % Py Scav Au Rec, % Cu Clnr 1 Tail Au Rec, % Au Extraction, % Au Recovery, %
Da Tambuk 72 24 57 4 16 Not Tested *97
Silica Hill 82 23 38 12 43 91 77
Mato Bula 93 27 83 8 3 52 85

The metallurgical work conducted to date is considered preliminary and more detailed testing will follow, to exploit opportunities that remain for more enhancements in overall metallurgical performance.

*Adyabo Agreement

Subject to a 2% N.S.R. For additional information about the Adyabo Agreement, please see Tigray Resources Inc. news release dated October 16, 2012.

Technical information included on this webpage was reviewed and approved by Andrew Lee Smith, P.Geo., the Company’s President and CEO, who is a Qualified Person as defined by NI 43-101.

Preliminary Economic Assessment (PEA) results have been reviewed and approved by the below noted Qualified Persons. The Qualified Persons have reviewed or verified the information for which they are individually responsible, including scientific, technical and economic information underlying the information or opinions contained herein.

Mark Horan, MSc. P.Eng. Senior Mine Engineer, “Independent Qualified Person”, under NI 43-101. Tetra Tech Resources Canada Inc.
Hassan Ghafari, P.Eng., Principal Metallurgist, “Independent Qualified Person”, under NI 43-101. Tetra Tech Resources Canada Inc.
David Thomas, P.Geo. Geologist, “Independent Qualified Person”, under NI 43-101. Fladgate Exploration Consulting Corporation.

Adyabo Project Technical Reports

To view the EAM technical reports, click on the links below:

  • Adyabo Project, Da Tambuk NI43-101 PEA Technical Report, June 12, 2018
  • Adyabo Project, Mato Bula NI43-101 PEA Technical Report, June 12, 2018
  • Adyabo Project, 43-101 Mineral Resource Technical Report, May 29, 2015
  • Adyabo Project, Ethiopa Published Trench Results
  • Adyabo Project, Ethiopa Published Drill Intercepts

Adyabo & Harvest Gold Projects Photo Gallery

Home

About

Ethiopia

– Harvest Project

– Adebayo Project

Tanzania

– Handeni Project

Investors

News

Contact

East Africa Metals Inc.

Corporate Office
777 Dunsmuir Street
17th Floor
Vancouver, BC V7Y 1K4
Canada

Mailing Address
PO Box 48658
STN Bentall Centre
Vancouver, BC V7X 1A3
Canada


East Africa Metals Inc.

Investor Relations
Tel: +1-604-488-0822
Toll Free: +1-866-488-0822
Email: [email address protected by javascript]


Branding and Design:
NextPhase Strategy Marketing Inc.

© Copyright - East Africa Metals Inc. – TSX-V EAM - Enfold WordPress Theme by Kriesi
  • Twitter
  • Facebook
  • LinkedIn
Scroll to top